The project
The agency inspects randomly hundreds of diggings on yearly basis with inspectors throughout the whole country. The current tooling was outdated and not user friendly: inspectors could not use the tool in the field and therefore did not have all the necessary information available during the inspection. Making relatively small changes to the tool was also a time-consuming process, something inspectors therefore rather avoided and were not keen on.
Throughout the years, the number of inspectors is declining while the number of diggings is increasing. This means the agency must carefully plan the total number of inspection hours based on a data-driven approach.
How we handled this
We set up a POC to see if we could make a tool which served all the needs of the inspectors. What we did briefly:
- Get all the requirements and needs of the inspectors during the inspection
- Predictive model that scores and classifies each current digging activity (low risk- medium risk – high risk of damage)
- A script/process to extract all current digging activities, select- transform and manipulate relevant data, include predictive model scores
- Host the application on an external R-Shiny server and make it available to the inspectors
Results
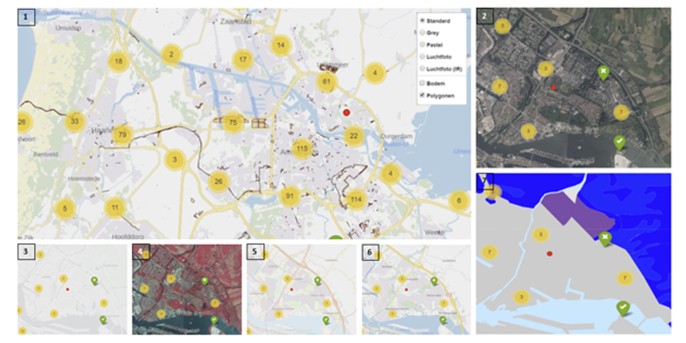
- A web based application with current up-to-date information on digging activities
- A web based application which can be used on different devices (mobile, laptop, tablet): inspectors have the option to turn on GPS and immediately see all digging activities in the area
- Inspections based on (data-driven) risk classification
- A visual representation of all the current digging activities on a map including alle relevant information for each digging activity


